Overview
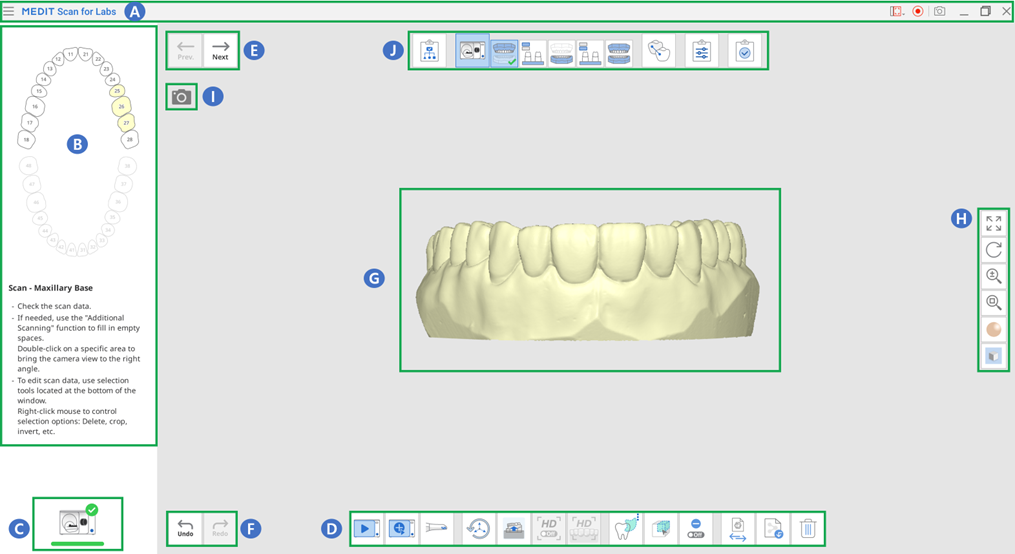
| A | Title Bar |
| B | Guide Image and Message |
| C | Scanner Status |
| D | Main Toolbar |
| E | Previous / Next Stage |
| F | Redo / Undo |
| G | Data Display Area |
| H | Side Toolbar |
| I | Live View |
| J | Stages (Workflow) |
Title Bar
The title bar includes the menu, capture options, and tools to resize the program window.
 | Menu | Provide basic program functions such as Settings, User Guide, and About. |
 | Submit Support Request | Land on a Medit Help Center page to submit a support request. |
 | Select Video Record Area | Select which area of the screen to record the video. The user can record the entire window of the program or only the area where 3D data is displayed. |
 | Start/Stop Video Recording | Start or stop video capturing. The captured video file can assist in communication between the patient, clinic, and laboratory. |
 | Screenshot | Capture the entire screen or only the 3D data display area of the scanning software. The captured image file can assist in communication between the patient, clinic, and laboratory. |
Clicking the Menu icon will show the following three options.
 | Settings | Set scan and calibration options for both table top and intraoral scanners. |
 | User Guide | Open the user guide. |
 | About | Provide detailed information about the software program and version. |
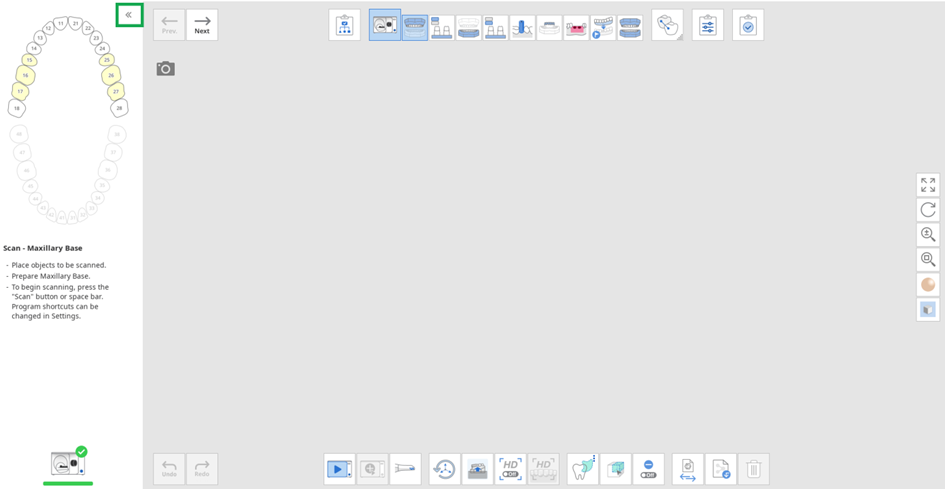
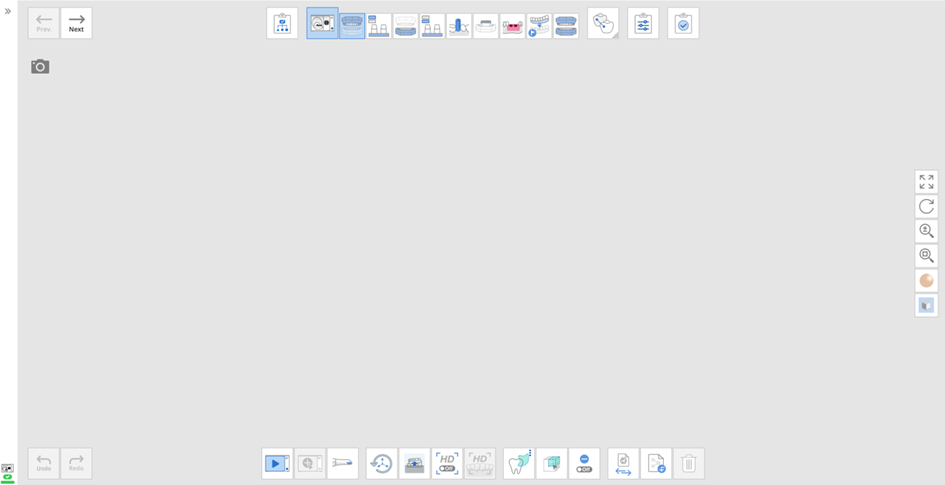
Guide Message
You can expand or collapse the Guide Message panel on the left side of the screen.
- Expanded
- Collapsed
Scanner Status
Following are the indications of scanner status:
 | Not Connected | A scanner is not connected. |
 | Ready | A scanner is ready for use. |
Side Toolbar
ℹ️Note
The data control tools listed below are especially helpful when you work on a touch screen.
 | Pan | Move the model. | |
 | Rotate | Rotate the model. | |
 | Zoom In/Out | Zoom in and out on the model. | |
 | Zoom Fit | Position the model in the center of the screen. | |
 | Data Display Mode | Matte | See the data in color with matte finish (Phong rendering). |
 | Monochrome | See the data in one color.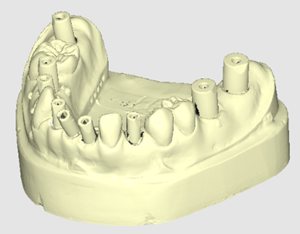 | |
 | Reliability Map | Apply red, yellow, and green colors to the model to indicate the reliability of scan data.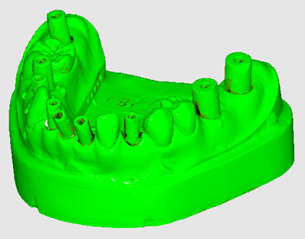 * Green data indicates high reliability, while red indicates poor reliability. You can perform additional scanning to reduce unreliable areas. * Green data indicates high reliability, while red indicates poor reliability. You can perform additional scanning to reduce unreliable areas. | |
 | Grid Settings (mm) | Grid On | Shows the grid in the background.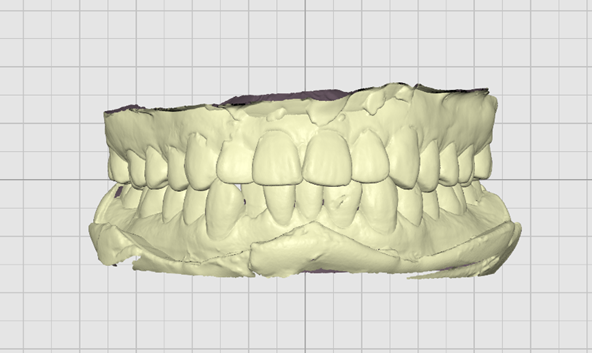 |
 | Grid Off | Hide the grid in the background.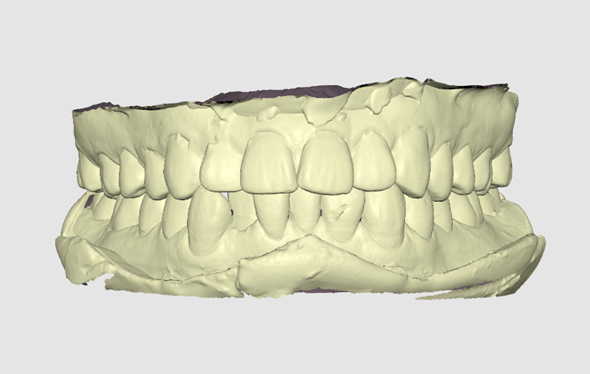 | |
 | Overlay On | Overlay the grid over the model.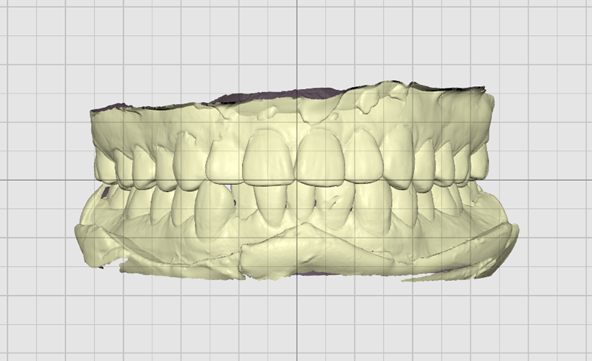 | |