User Interface at a Glance (based on Windows)
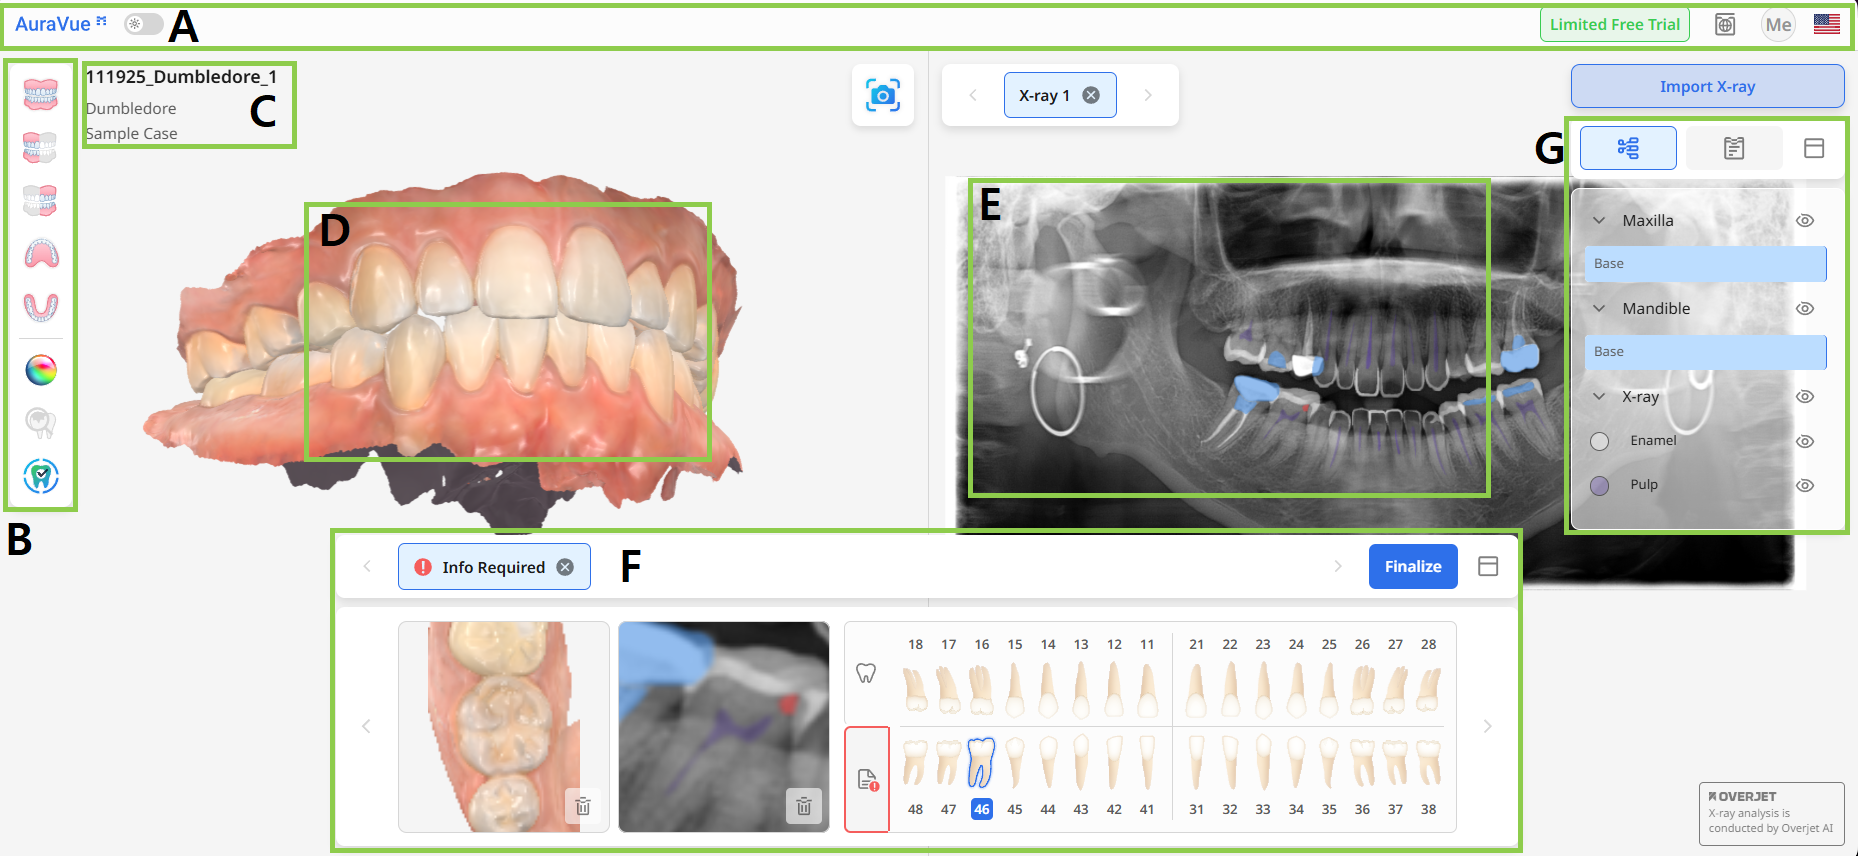
A | Header Bar |
B | Toolbox |
C | Case Information |
D | 3D Data |
E | X-ray |
F | Report Panel |
G | Side Panel |
🔎Note
The user interface may slightly differ depending on your device (e.g., iPad).
Header Bar
The Header Bar is located at the top of the page interface. It displays the name of the application and provides quick access to basic program controls.
Light/Dark Mode | A toggle that allows the user to switch between light and dark themes for the application interface. |
Menu | The menu button provides access to the User Guide and other related resources. |
Account Icon | Provides identification of the logged-in account. |
Language Settings | Allows the user to change the display language of the application interface. By default, the language settings from Medit Link are applied. |
Toolbox
The Toolbox is located in the top left corner of the screen and provides two types of tools: one for controlling the scan data and another to support the report creation process.
| Front | See the front side of the data. |
| Left Lateral | Show the left lateral side of the data. |
| Right Lateral | Show the right lateral side of the data. |
| Occlusal Surface (Maxilla) | Show the maxillary occlusal surface. |
| Occlusal Surface (Mandible) | Show the mandibular occlusal surface. |
| Data Display Mode | Switch the data display mode among “Glossy,“ “Matte,“ and “Monochrome.” |
| Show Visual Cues | Show or hide markings on areas recommended for detailed review. |
| Show Reported Areas | Locate all areas added to the report on the scan data. |
| Capture | Take a screenshot of the area you want to include in the report. |
| Import X-ray | Import radiographs from a local folder. |


Side Panel
The Side Panel, located on the right side of the screen, provides access to the Data Tree and Report List. Each tab allows the user to manage the available case data and generated reports efficiently. You can collapse this panel if needed by clicking the icon to the left of the Data Tree tab.
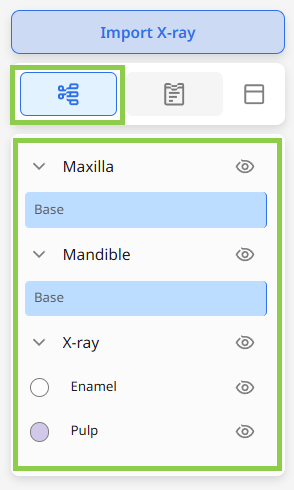
Data Tree
In this tab, users can control visibility of the scan data and X-ray analysis data: click and drag the blue line to adjust transparency, or click the eye icon to show or hide data.
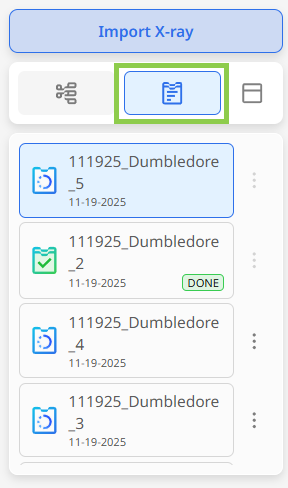
Report List
In this tab, users can preview all reports associated with the currently open case. Drafts are marked in blue, while finalized reports are marked in green with a 'DONE' label. Click the three dots next to a report to delete it.
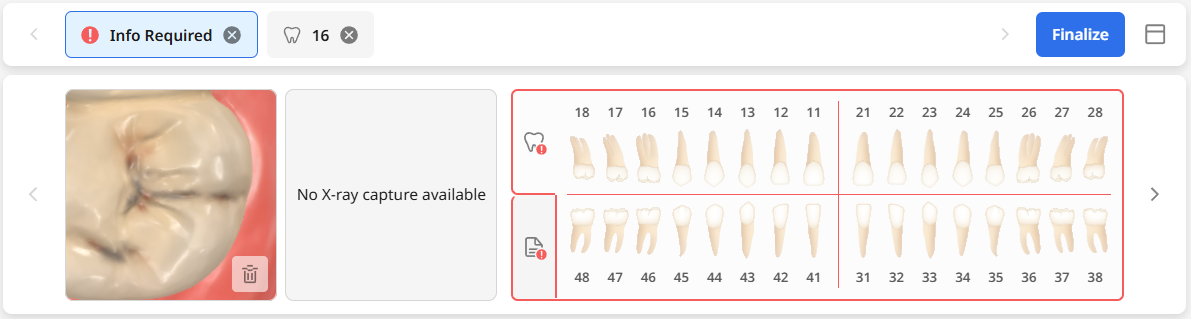
Report Panel
The panel at the bottom of the screen shows a list of all the pathologies identified by the user. Each entry includes the associated scan data, X-ray image, and an information form completed by the doctor with the suspected diagnosis, proposed treatment, and a memo. The panel can be collapsed by clicking the icon to the right of the “Finalize” button.
Incomplete report entries are marked with a red exclamation mark, and users cannot finalize the report until all entries are completed.