This step shows the deviation between the CAD design and milled prosthesis data through color to help check for parts needing alterations on the milled prosthesis. Align your crown data before working in this step.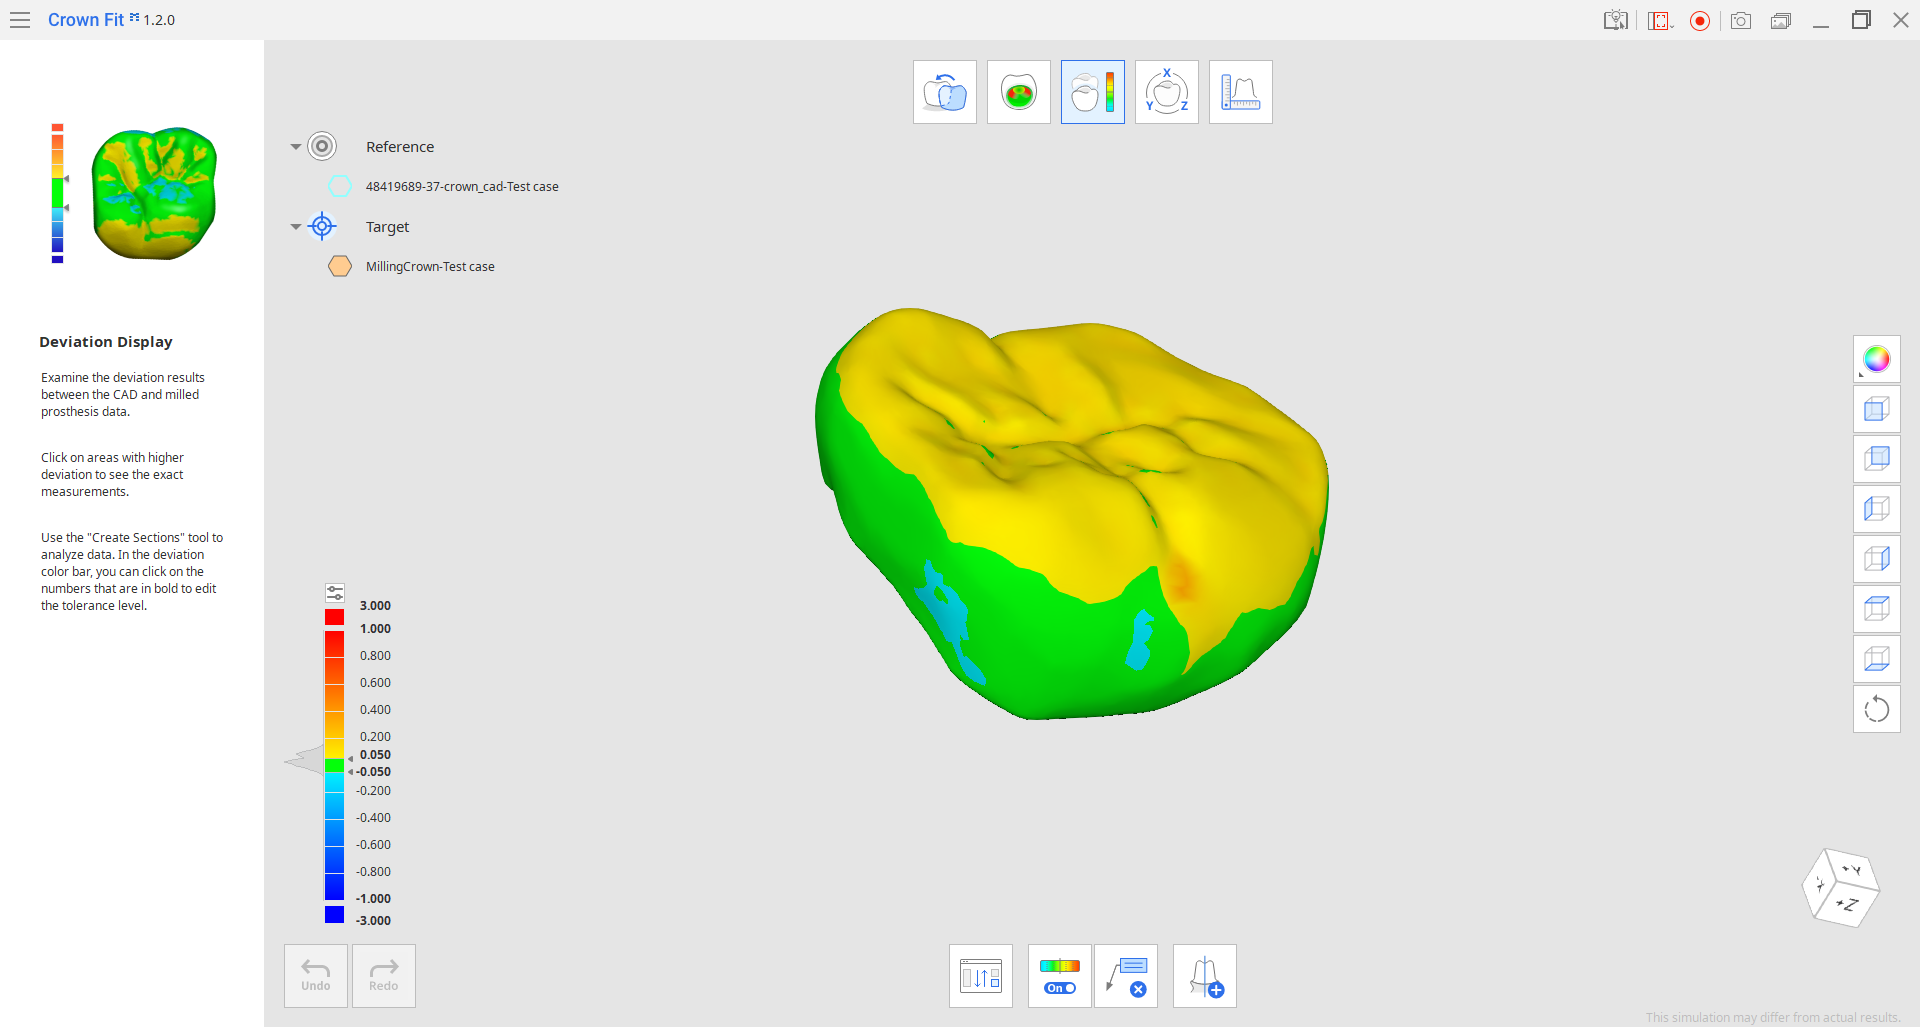
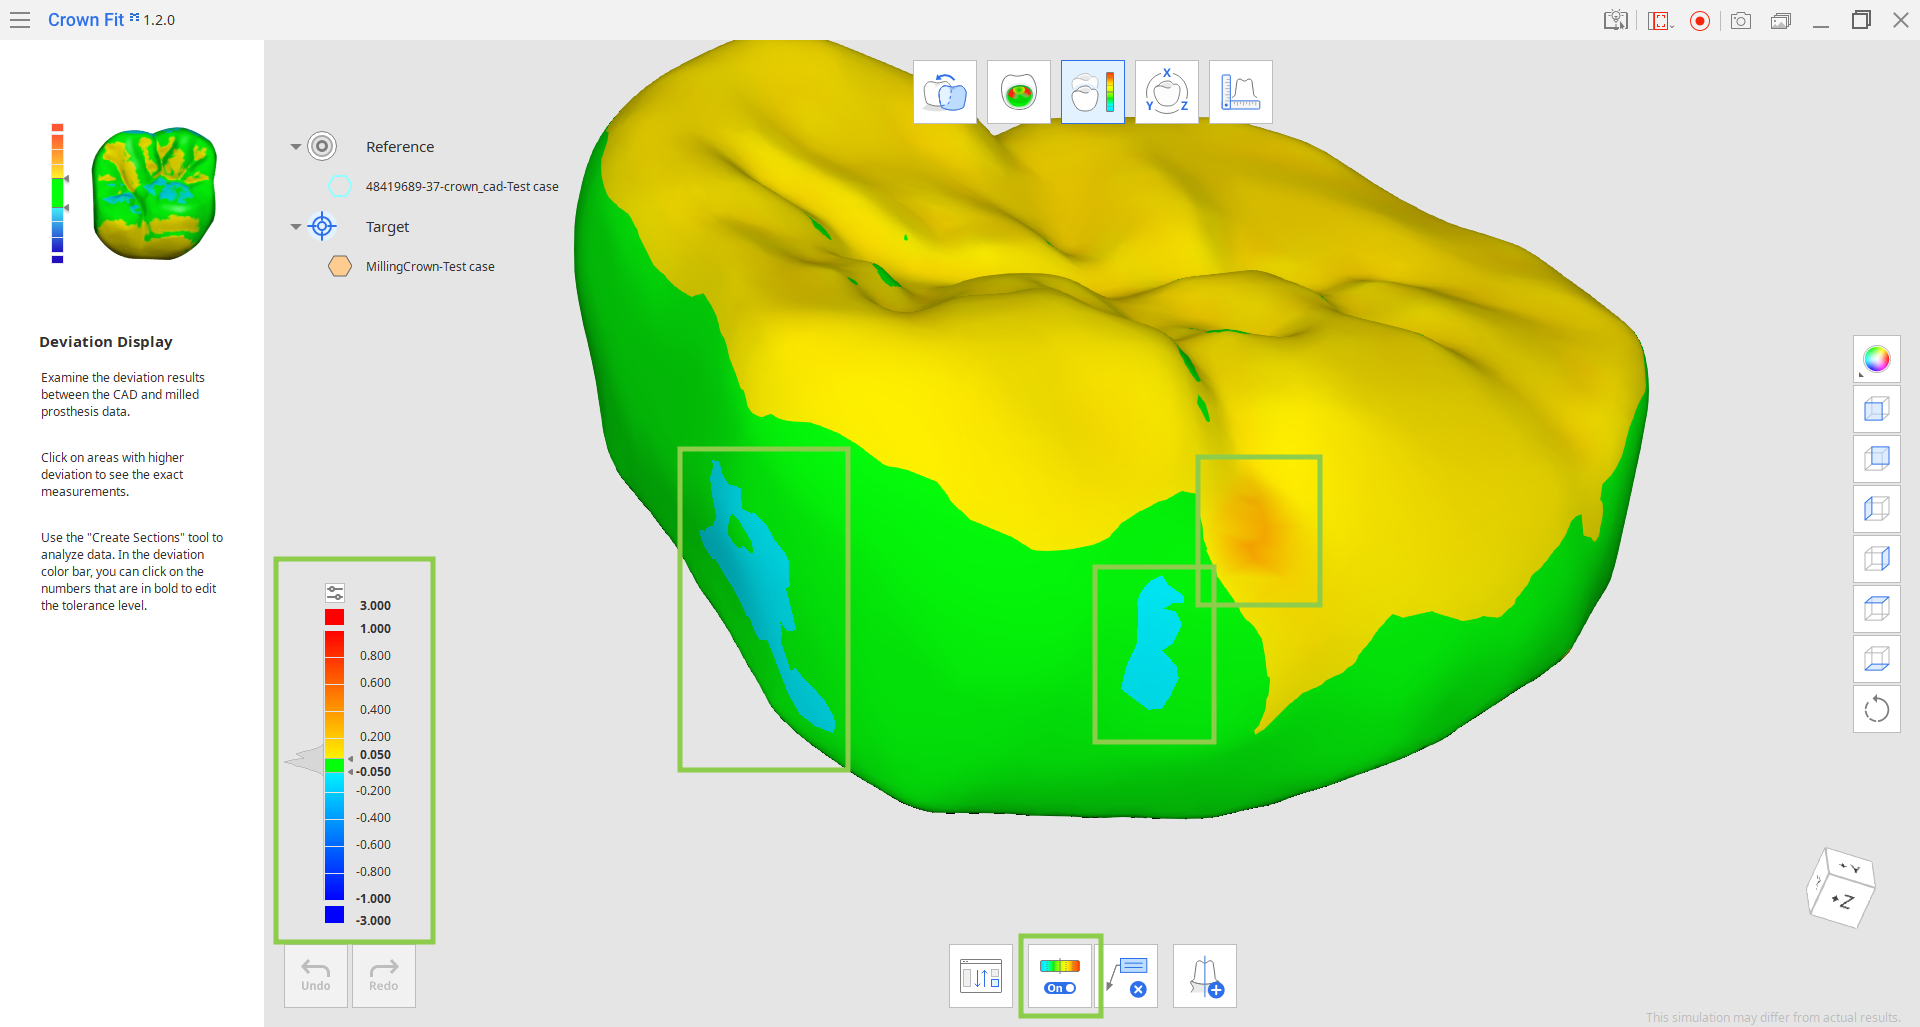
- The color map is turned on by default once you enter this step. Review areas with high deviation in more detail to check whether the milled prosthesis requires additional adjustment.🔎NoteClick the small settings icon above the color bar to adjust the resolution of the color map. You can also click the bold numbers to enter the specific values.
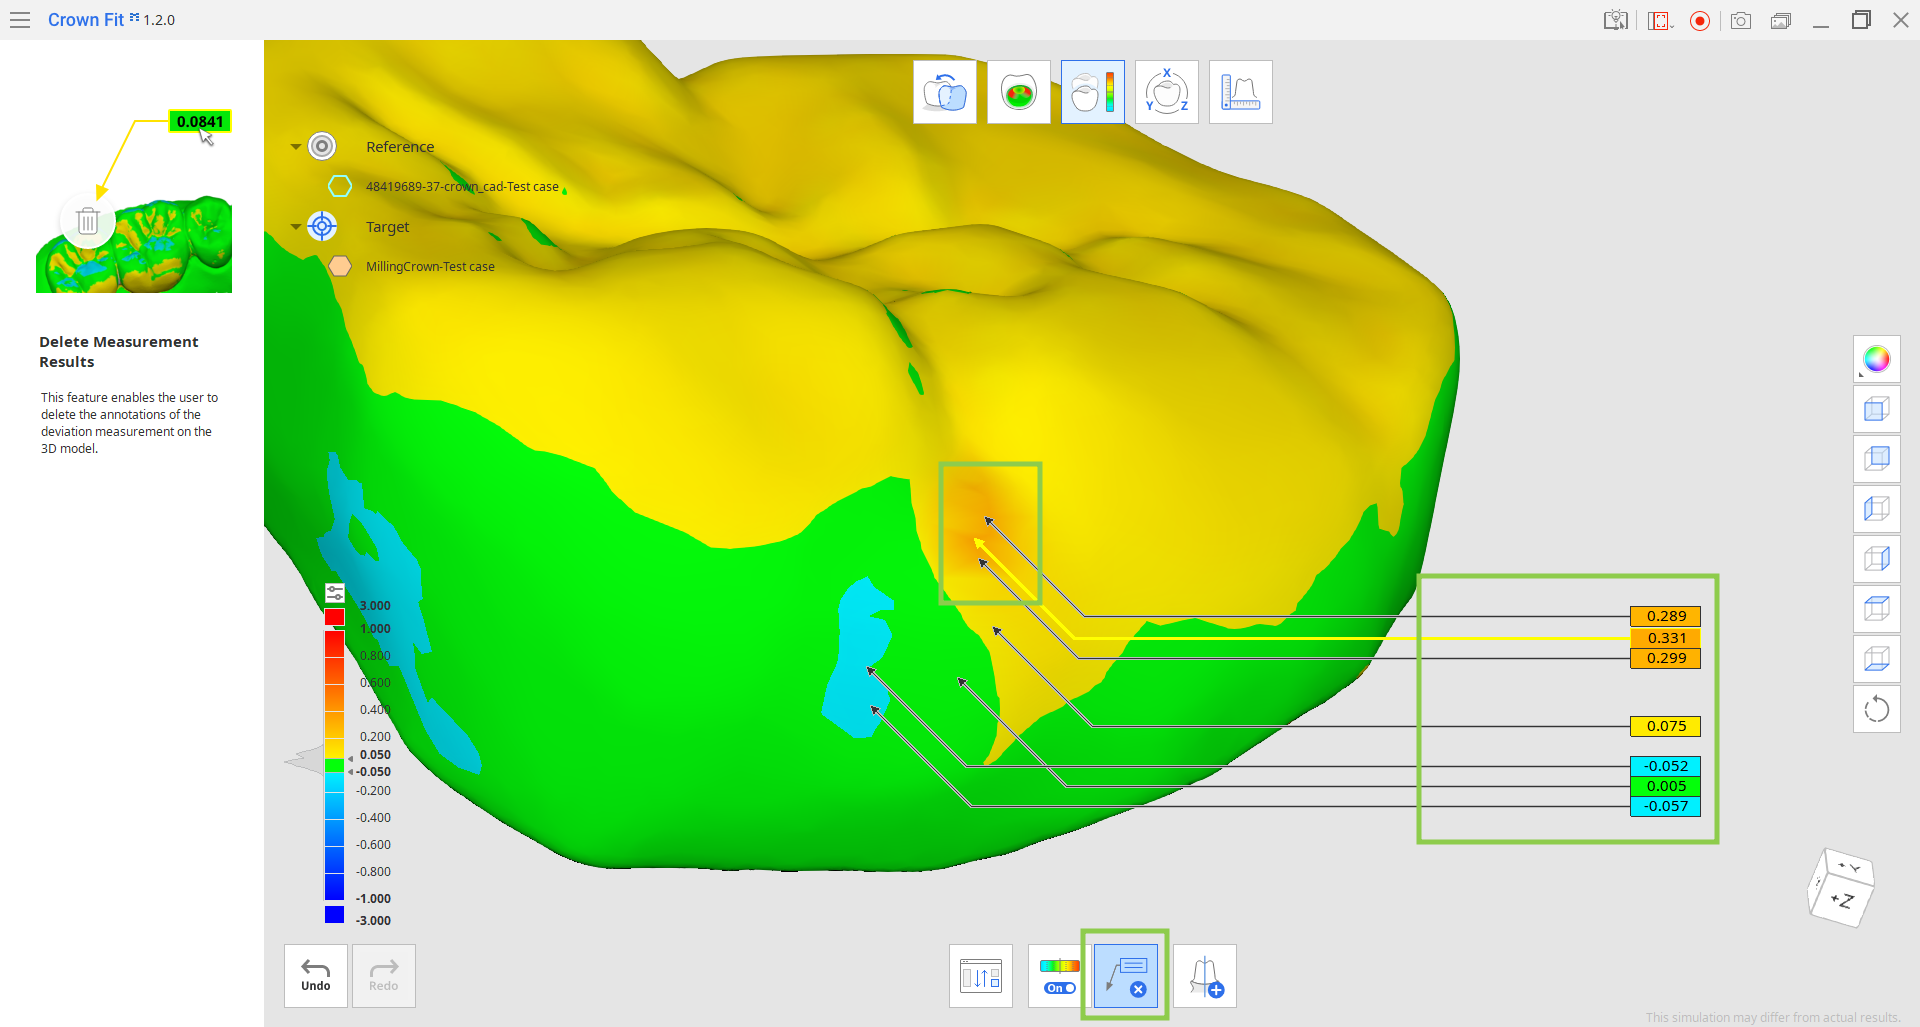
- Click on any spot of higher deviation to annotate it with an exact deviation measurement. If you want to delete any measurement results, activate the "Delete Measurement Results" feature and remove the annotation with a click.🔎TipMeasurement results are not saved if you move to another step. Use the "Screenshot" feature in the Title Bar to keep a record if needed.
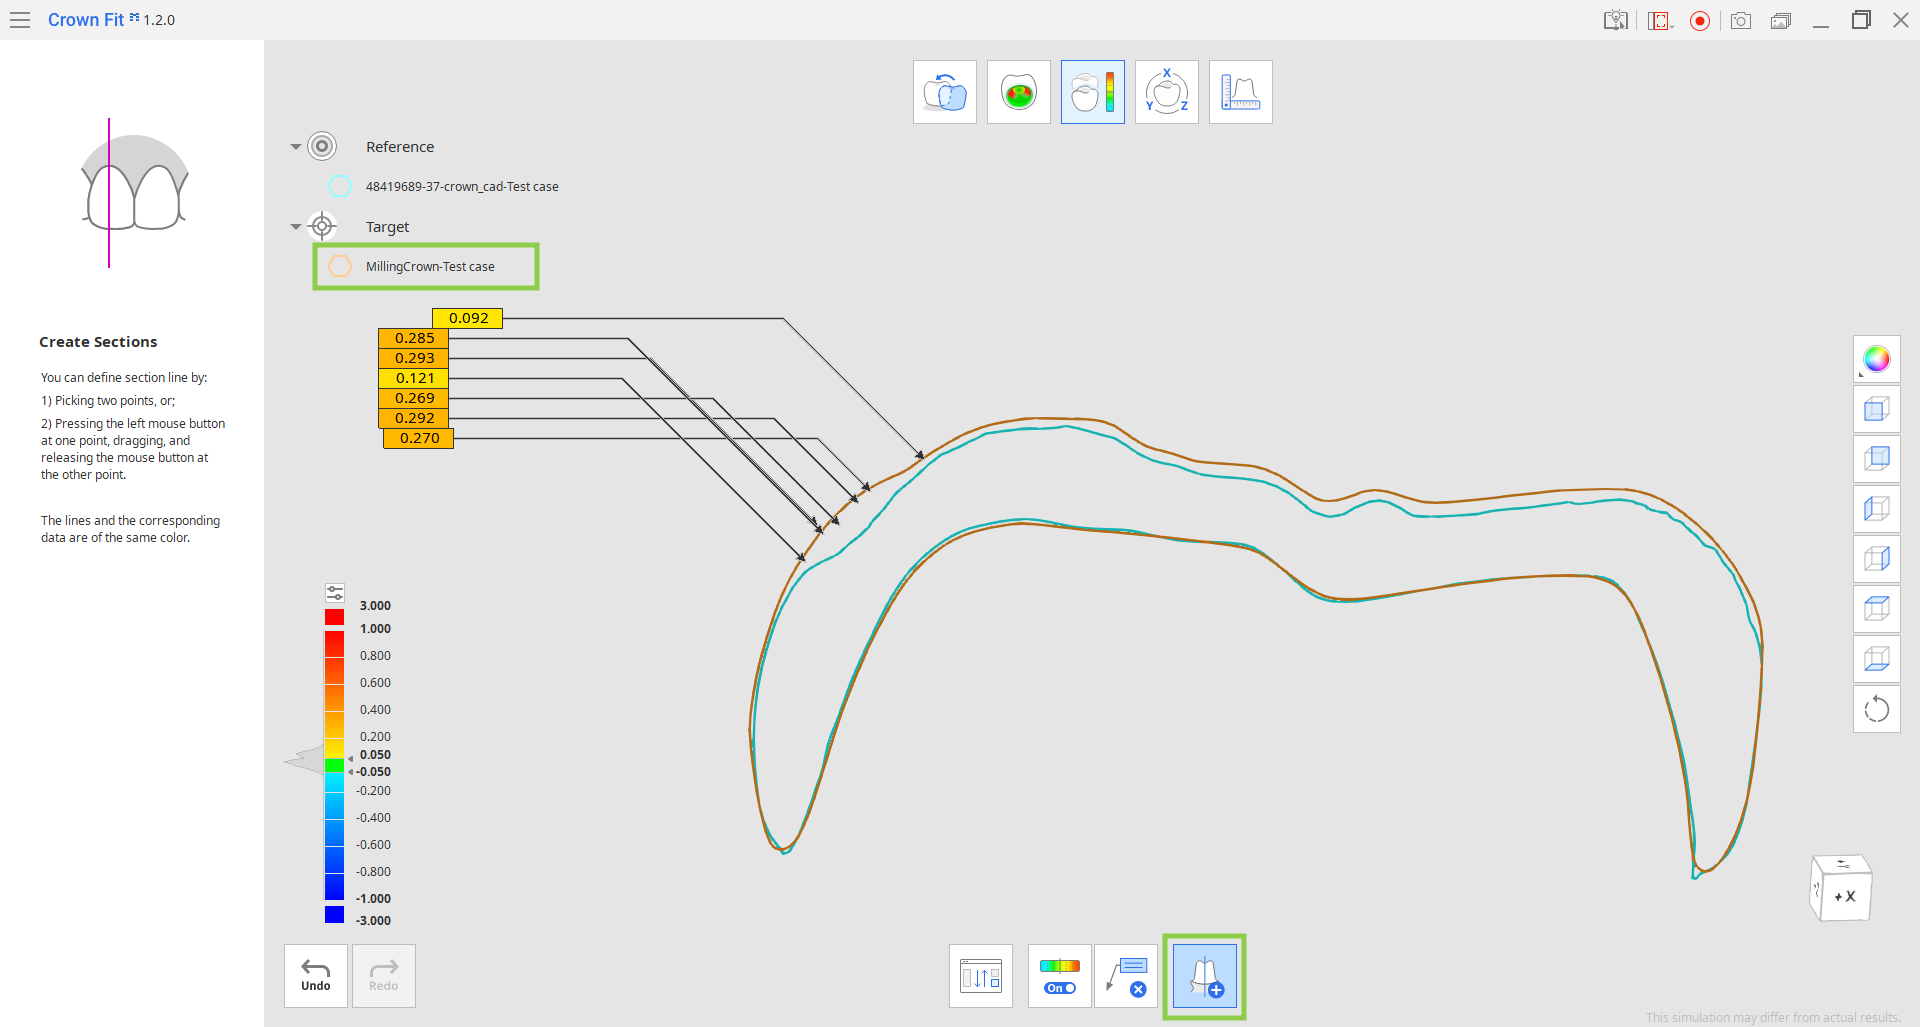
- Use "Create Sections" to draw section lines on the data by picking two points or click-and-drag. Section lines will show you the outlines of both reference and target data; hide data to see them clearer. All created section lines will disappear once the feature is deactivated, yet they will be saved and available in the Measurement step.
- If needed, you can change what data is assigned as reference and target using "Reassign Data."