Uživatelské rozhraní v kostce
.png)
A | Panel záhlaví |
B | Panel poznámek |
C | 3D Data |
D | Nástroje |
E | Boční panel |
Panel záhlaví
Panel záhlaví je umístěn v horní části Medit Checkpoint rozhraní. Zobrazuje název aplikace a poskytuje rychlý přístup k základním ovládacím prvkům programu.
Světlý/Tmavý režim | Přepínač, který umožňuje uživateli přepínat mezi světlým a tmavým motivem rozhraní aplikace. |
Menu | Tlačítko menu umožňuje přístup k Uživatelské příručce. |
Ikona účtu | Nabízí identifikaci přihlášeného účtu. |
Nastavení jazyků | Umožňuje uživateli změnit jazyk zobrazení rozhraní aplikace. Ve výchozím nastavení se použijí nastavení jazyku z Medit Link. |
Panel poznámek
Panel na levé straně obrazovky zobrazuje seznam snímků, které budou zahrnuty do poznámky. Každý snímek je doplněn formulářem vyplněným lékařem, obsahuje informace o počáteční diagnóze, léčbě a odhadovaných nákladech. Tento panel můžete v případě potřeby sbalit kliknutím na ikonu napravo od tlačítka „Dokončit“.
Pokud je formulář pro snímek neúplný, v rohu se zobrazí červený vykřičník. Poznámku nelze dokončit, pokud je formulář snímku neúplný..png)
Nástroje
Funkce Nástroje je umístěna ve spodní části obrazovky a poskytuje dva typy nástrojů: jeden pro kontrolu naskenovaných dat a druhý pro podporu procesu tvorby poznámky.
| Přední | Přohlédnout si přední stranu dat. |
| Levý laterální | Zobrazí levou laterální stranu dat. |
| Pravý laterální | Zobrazí pravou laterální stranu dat. |
| Povrch okluze (Maxilla) | Zobrazuje maxillární povrch okluze. |
| Povrch okluze (Mandibula) | Zobrazuje mandibulární povrch okluze. |
| Režim zobrazení dat | Přepněte režim zobrazení dat mezi „Lesklý“, „Matný“ a „Monochrom“. |
| Zobrazit vizuální značky | Zobrazte nebo skryjte označení v oblastech vyžadujících konzultaci. |
| Zobrazit oblasti s poznámkami | Lokalizujte všechny oblasti přidané do poznámky na datech skenování. |
| Zachytit | Pořiďte snímek obrazovky oblasti, kterou chcete zahrnout do poznámky. |

.png)


.png)
Boční panel
Boční panel na pravé straně obrazovky poskytuje přístup k Datovému stromu a seznamu všech poznámek souvisejících s tímto případem. Každá karta povoluje uživateli efektivně spravovat příslušná naskenovaná data a vytvořené poznámky. Tento panel můžete v případě potřeby sbalit kliknutím na ikonu vlevo od karty „Datový strom“.
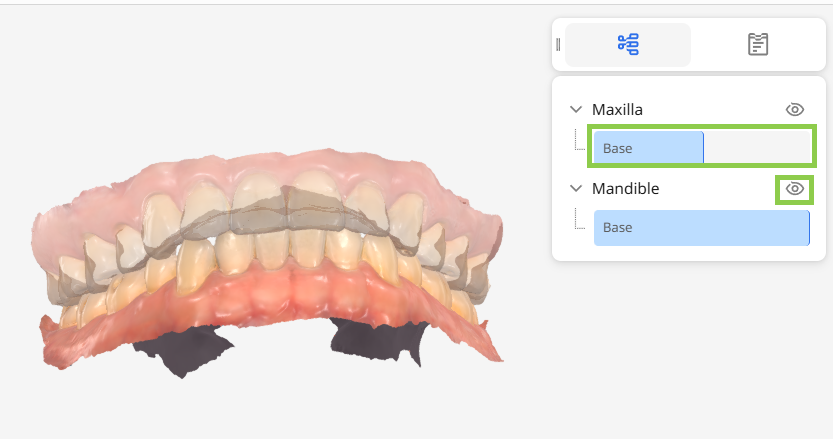
Datový strom
Na této kartě mohou uživatelé ovládat viditelnost dat: kliknutím a přetažením modré linky upravíte průhlednost nebo klikněte na ikonu oka pro zobrazení či skrytí dat.
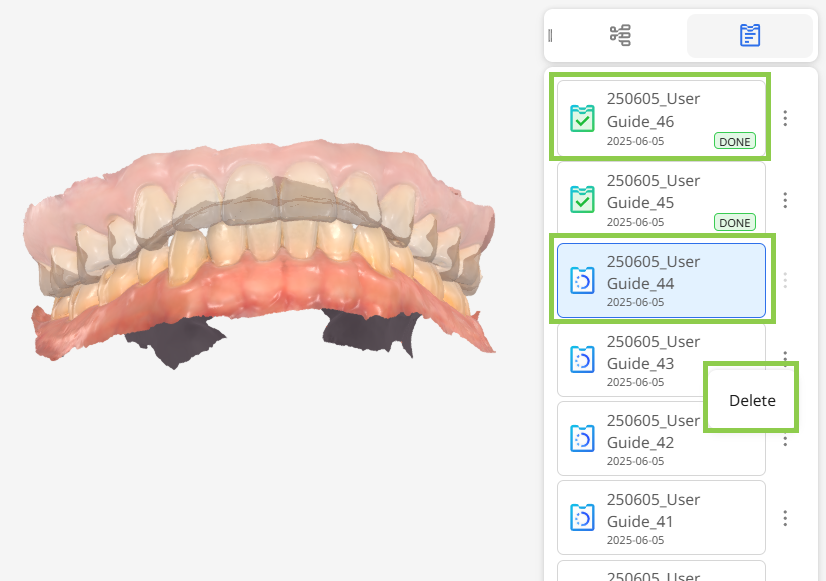
Seznam poznámek
Na této kartě si uživatelé mohou zobrazit náhled všech poznámek asociovaných s aktuálně otevřeným případem. Koncepty jsou označeny modře, zatímco dokončené poznámky jsou označeny zeleně s popiskem „DONE“. Kliknutím na tři tečky vedle libovolné poznámky ji smažete.